
Introduction
The simple data logger you are already familiar with records any specified input voltage with respect to time, however, it is often desirable to vary one output parameter, and study the effect on some other aspect of the experiment.
In the advanced data logger, both X and Y can be chosen from the following list
- Inputs
- Time
- Voltmeter: A1,A2,A3,IN1,SEN,AN8,CCS
- Capacitance
- Resistance
- Oscilloscope
- Extracted frequency,phase,amplitude or offset using a sine fit
- Difference in phase between A1(Any analog input) and A2. Also, ratio of amplitudes.
- Frequency on IN2
- Any connected I2C sensor (Magnetometer, accelerometer, temperature, gyro etc)
- Select 1 parameter from any of the detected sensors added automatically to the list
- SR04 distance sensor
- Outputs (Start and End must be specified)
- WG Sine wave generator frequency
- SQ1, SQ2 square wave generator
- PV1, PV2 voltage outputs
Characterising a piezo buzzer
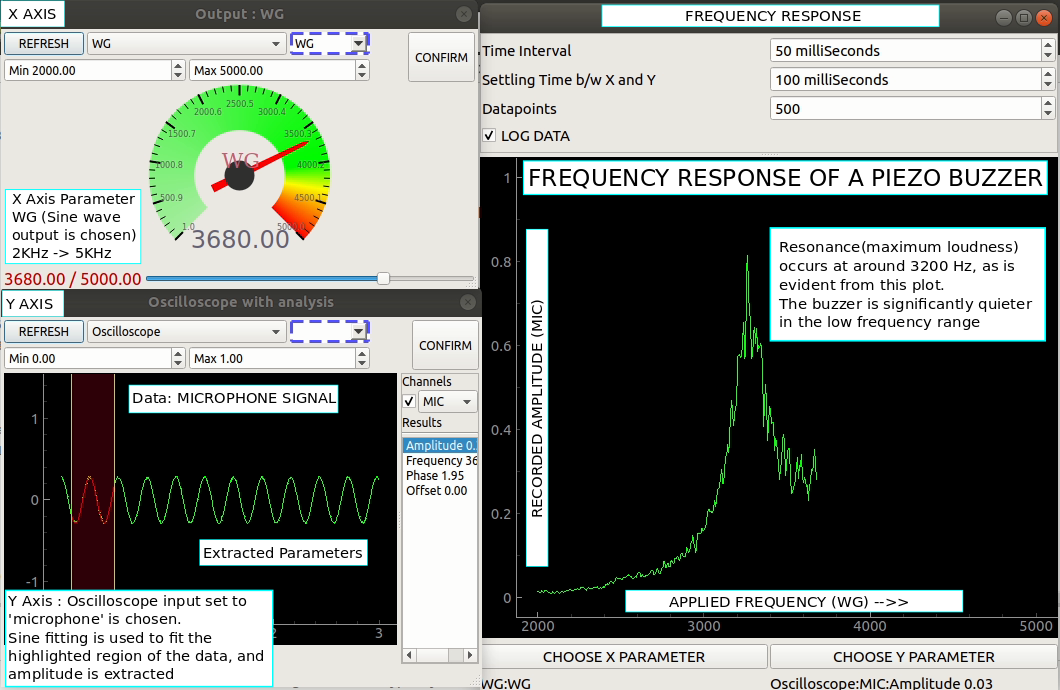
Advanced data logger showing the X parameter set to WG sine generator, and Y parameter(input) as amplitude extracted from microphone channel of the oscilloscope.
Procedure
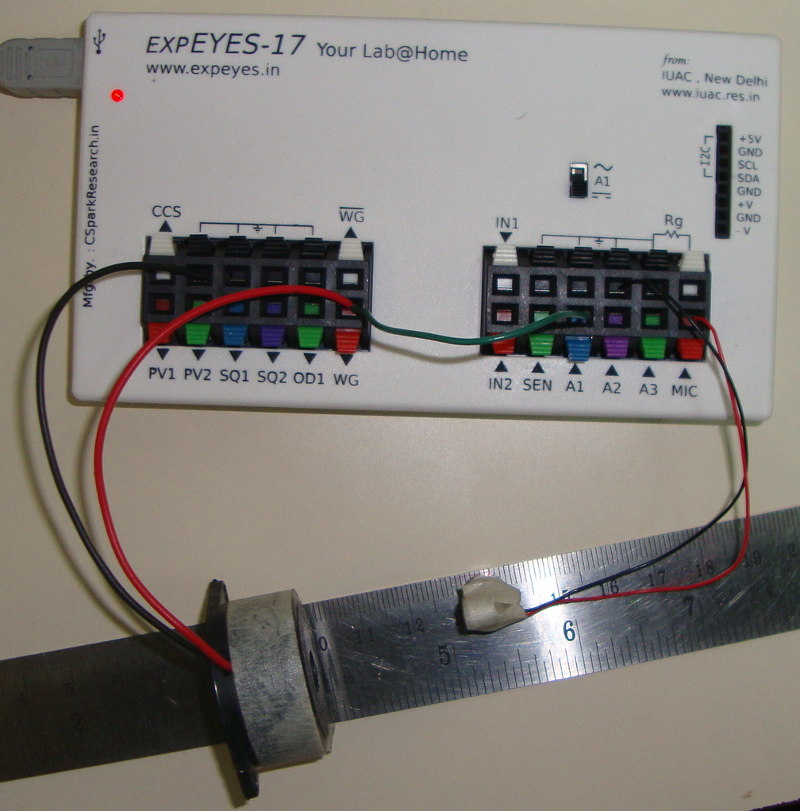
- The frequency waveform generator WG is connected to a Piezo buzzer.
- X parameter is set to WG. Minimum 2000Hz, Maximum 5000Hz
- A microphone is connected to MIC input
- Y parameter is set to oscilloscope
- Channel is selected as MIC
- Amplitude is selected
- Cross check frequency button is enabled
The logger will measure the microphone signal’s amplitude for N different frequency values supplied to the buzzer, where N can be specified before enabling the log.
A settling delay of 100mS is set to allow the piezo buzzer to settle into a new frequency before measuring the stable amplitude.
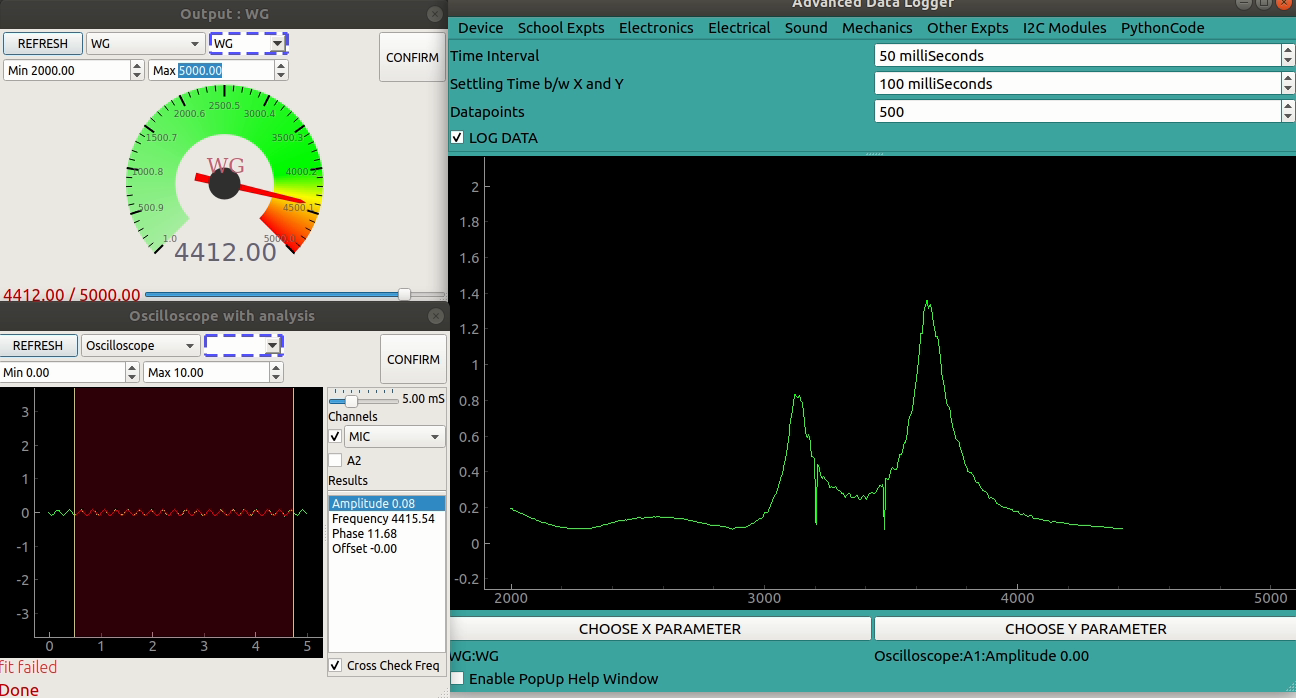
500 datapoints were acquired, and the piezo buzzer was found to have two resonant frequencies.
Video
Frequency response of a piezo buzzer
Applications
This versatile tool can be used for a host of experiments such as bode plots, standing wave characterisation, spectrum analyis etc
Bode plots
Characterise electrical filters such as low-pass, band-pass and notch filters
- Connect WG to the input of the circuit, and also to A1
- Connect the output of the circuit to A2
- Select X parameter as WG from 5Hz to 5000Hz
- Select Y as oscilloscope
- Enable A2 also
- Select amplitude1/amplitude2 as the value to be plotted
- Start logging data
Resonance using square wave generator
A square wave generator is composed of sine waves, and the series expansion looks something like Asin(fx) + Asin(3fx)/3 + Asin(5fx)/5 + …
It is evident that a 1000Hz square wave will also contain 3000Hz, 5000Hz and so on with decreasing amplitudes…
To verify this, we first connected a buzzer to WG( pure sine wave), and obtained its resonant frequency. It was found to have two resonances, and mini peaks at F/3, F/5 and so on… Refer to new post