Experiment: V-I Characteristics of a PN Junction Diode
1. Aim
To plot the V-I characteristic curve of a PN junction diode (1N4148), to compare the forward characteristics of a silicon diode, a red LED, and a green LED, and to extract the Boltzmann constant $k$ by fitting the diode equation to the experimental data.
2. Apparatus / Components Required
- SEELab3 unit
- Diodes: 1N4148 (silicon), red LED, green LED
- Series resistor $R = 1\text{ k}\Omega$
- Connecting wires
- PC with Python 3 (libraries:
expeyes,numpy,scipy,matplotlib)
3. Theory & Principle
3.1 The Diode Equation
The ideal PN junction follows the Shockley diode equation:
\[\boxed{I = I_0 \left( e^{\,qV/nkT} - 1 \right)}\]where:
| Symbol | Meaning | Typical value |
|---|---|---|
| $I_0$ | Reverse saturation current | $\sim 10^{-9}$ A (Si) |
| $q$ | Electron charge | $1.602 \times 10^{-19}$ C |
| $V$ | Voltage across diode | — |
| $n$ | Ideality factor | $\approx 1$ (Ge), $\approx 2$ (Si) |
| $k$ | Boltzmann constant | $1.381 \times 10^{-23}$ J/K |
| $T$ | Temperature | $\approx 300$ K (room temp) |

For $V \gg nkT/q$ (forward bias, $V \gtrsim 0.1\text{ V}$), the $-1$ term is negligible and:
\[I \approx I_0\, e^{\,qV/nkT}\]Taking the natural log:
\[\ln I = \ln I_0 + \frac{q}{nkT} \cdot V\]A plot of $\ln I$ vs $V$ is therefore a straight line with slope $m = q/(nkT)$. Since $q$, $n$, and $T$ are known, the Boltzmann constant can be extracted:
\[\boxed{k = \frac{q}{n \cdot m \cdot T}}\]3.2 Current Measurement by Indirect Method
No ammeter is needed. The series resistor $R$ carries the same current as the diode. With PV1 supplying voltage $V_{PV1}$ and A1 measuring the diode voltage $V_D$:
\[I = \frac{V_{PV1} - V_D}{R}\]PV1 is swept in small steps; at each step $V_{PV1}$ and $V_D$ (from A1) are recorded and $I$ is calculated.
3.3 LED Forward Voltage
LEDs are also PN junctions but their bandgap differs from silicon, giving a higher forward voltage. The forward voltage is approximately:
| Device | Material | Approx. $V_f$ |
|---|---|---|
| 1N4148 | Silicon | $0.6$–$0.7\text{ V}$ |
| Red LED | GaAsP | $1.8$–$2.0\text{ V}$ |
| Green LED | GaP / InGaN | $2.0$–$3.5\text{ V}$ |
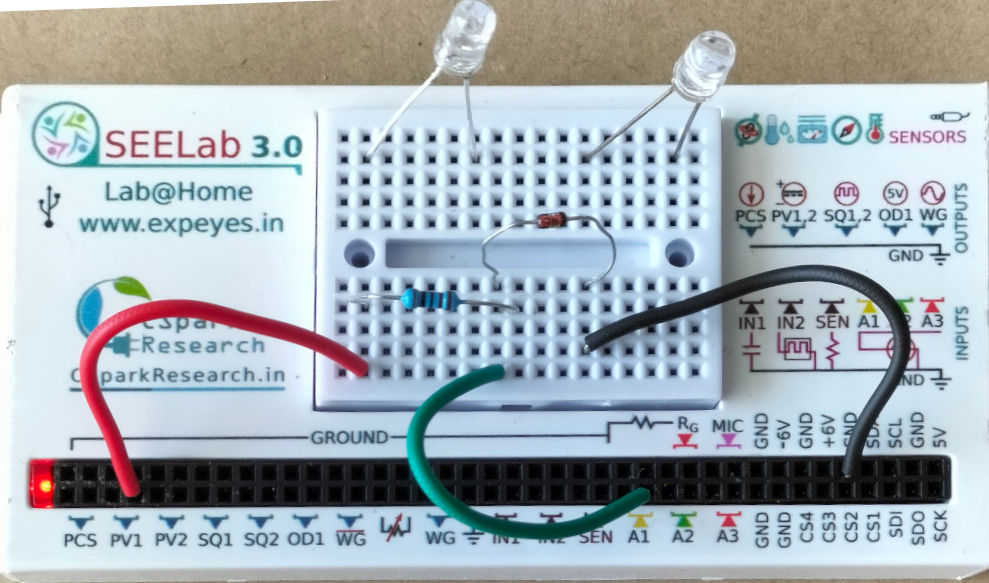
4. Circuit Diagram / Setup
- Connect PV1 to one end of $R$ ($1\text{ k}\Omega$).
- Connect the other end of $R$ to the anode of the diode.
- Connect the cathode of the diode to GND.
- Connect A1 across the diode — anode to A1, cathode to GND — to measure $V_D$.
The voltage across $R$ is $V_{PV1} - V_{A1}$, so the current $I = (V_{PV1} - V_{A1})/R$ at each step.
5. Procedure
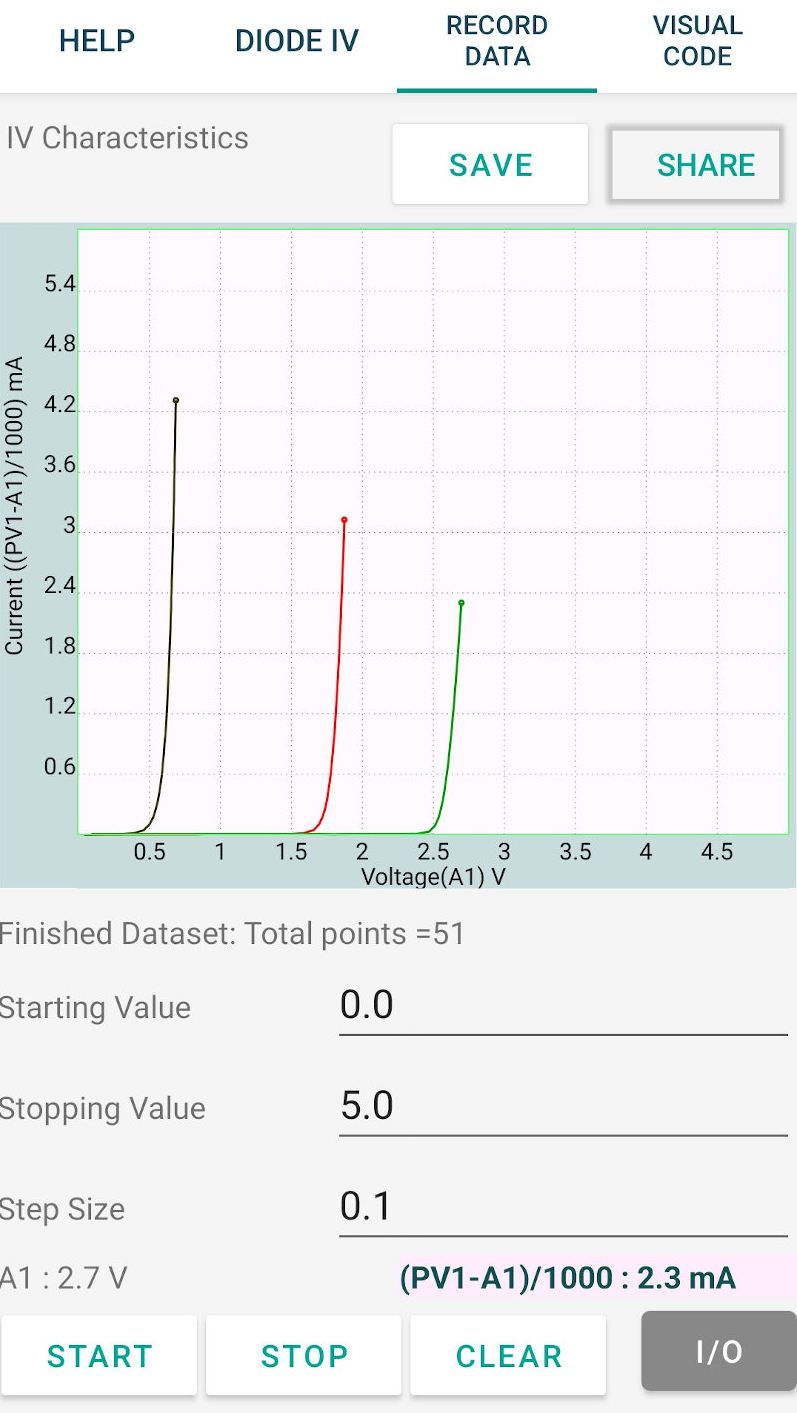
Part A — App-based sweep
- Open the SEELab3 app and select the “Diode V-I” experiment.
- The software sweeps PV1 from $0\text{ V}$ to its maximum in small steps, recording $V_{PV1}$ and $V_{A1}$ at each step, and computes $I = (V_{PV1} - V_{A1})/R$ automatically.
- The V-I curve is plotted directly. Observe:
- The exponential rise in current once $V_D$ exceeds $\approx 0.6\text{ V}$ for 1N4148.
- The nearly zero current in the reverse-bias region (swap connections to reverse-bias the diode).
- Replace 1N4148 with the red LED, then the green LED, and repeat. Note the higher forward voltage for each.
Part B — Python automation and Boltzmann constant extraction
- Python program to generate VI characteristics and save the data.
- Sample Data
- Python program to analyse the data to extract the Boltzmann constant.
Mobile App
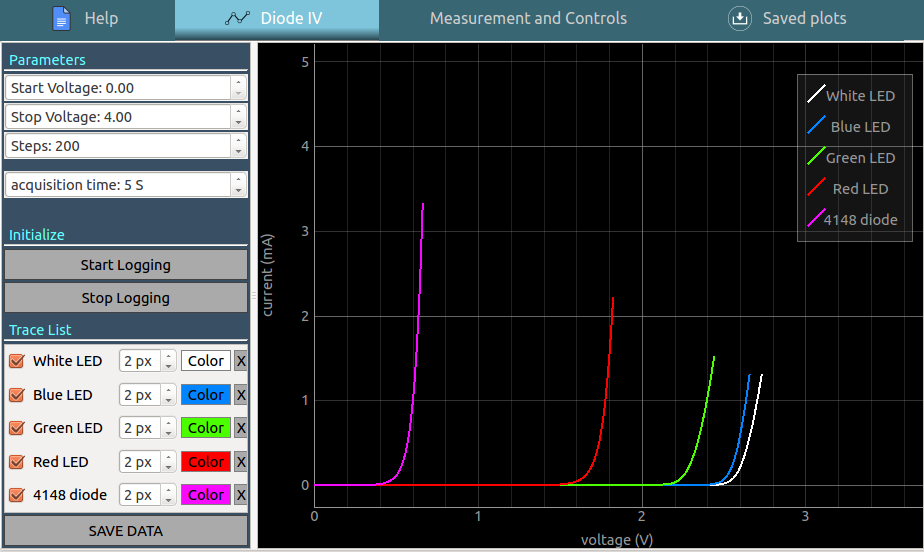
Desktop App
6. Observation Table
| $R$: ____ $\Omega$ | Temperature $T$: ____ K |
6a. Forward Bias — Manual Readings (1N4148)
| $V_{PV1}$ (V) | $V_D$ at A1 (V) | $I = (V_{PV1}-V_D)/R$ (mA) | $\ln(I)$ |
|---|---|---|---|
| 0.2 | |||
| 0.4 | |||
| 0.5 | |||
| 0.55 | |||
| 0.6 | |||
| 0.65 | |||
| 0.7 | |||
| 0.75 | |||
| 0.8 |
6b. Forward Voltage Comparison
| Device | $V_f$ at $I \approx 1\text{ mA}$ (V) | $V_f$ at $I \approx 5\text{ mA}$ (V) |
|---|---|---|
| 1N4148 (Silicon) | ||
| Red LED | ||
| Green LED |
6c. Boltzmann Constant Extraction (from Python fit)
| Quantity | Value |
|---|---|
| Slope $m$ of $\ln(I)$ vs $V$ (V$^{-1}$) | |
| Assumed ideality factor $n$ | 2 |
| Temperature $T$ (K) | 300 |
| Calculated $k = q/(n \cdot m \cdot T)$ (J/K) | |
| Accepted value of $k$ (J/K) | $1.381 \times 10^{-23}$ |
| Percentage error (%) |
7. Results and Discussion
- The V-I curve showed negligible current below $\approx 0.5\text{ V}$ and an exponential rise beyond the cut-in voltage, consistent with the Shockley equation.
- The forward voltage at $1\text{ mA}$ was ____ V for 1N4148, ____ V for the red LED, and ____ V for the green LED, reflecting the increasing bandgap from silicon to III-V semiconductors.
- A plot of $\ln(I)$ vs $V_D$ gave a straight line in the forward-bias region with slope $m =$ ____ V$^{-1}$.
- The extracted Boltzmann constant was $k =$ ____ J/K, a ____ % deviation from the accepted value of $1.381 \times 10^{-23}$ J/K.
- Deviations from the ideal Shockley equation arise from series resistance in the bulk semiconductor at high currents and from recombination currents (affecting the ideality factor $n$) at low currents.
8. Precautions
- Series resistor is mandatory: Never connect PV1 directly to the diode anode without $R$. Once the diode turns on, its dynamic resistance is only a few ohms — without $R$ to limit current, the diode will be destroyed.
- PV1 sweep limit: Keep $V_{PV1} \leq 3\text{ V}$ for the 1N4148 to stay within safe current. At $V_D = 0.7\text{ V}$, the resistor drops $3 - 0.7 = 2.3\text{ V}$, giving $I = 2.3\text{ mA}$ — well within the diode’s rating.
- LED current limit: LEDs are more sensitive to overcurrent than signal diodes. Keep $I_{LED} < 10\text{ mA}$ — set the PV1 upper limit in the Python script accordingly.
- Temperature stability: The diode equation is strongly temperature-dependent ($k$ extraction assumes $T = 300\text{ K}$). Avoid heating the diode by running high currents for extended periods; take measurements quickly.
- Ideality factor $n$: Use $n = 2$ for silicon (1N4148) in the Boltzmann extraction. Using $n = 1$ will give a result approximately twice the correct value of $k$.
9. Troubleshooting
| Symptom | Possible Cause | Corrective Action | | :— | :— | :— | | V-I curve is along x-axis till the end | Diode inserted backwards — measuring resistor drop only. | Reverse the diode; confirm anode is toward $R$, cathode to GND. | | Current rises immediately at $V_{PV1} > 0$ | A1 connected to wrong node (measuring $V_R$ instead of $V_D$). | Move A1 to the anode of the diode (junction between $R$ and diode). | | Extracted $k$ is twice the accepted value | Ideality factor $n = 1$ used instead of $n = 2$ for silicon. | Set $n = 2$ in the analysis script. | —
10. Viva-Voce Questions
Q1. What does the ideality factor $n$ represent, and why does it differ between silicon and germanium?
Ans: The ideality factor $n$ accounts for how closely a real diode follows ideal behaviour. $n = 1$ means the dominant current mechanism is minority carrier diffusion across the junction (ideal). $n = 2$ means recombination current in the depletion region dominates — this is typical of silicon at low forward bias. Germanium has a narrower bandgap, much smaller depletion region recombination, and behaves closer to ideal ($n \approx 1$). In practice silicon diodes show $n$ between 1 and 2 depending on the current level and device construction.
Q2. Why does the forward voltage of an LED depend on its colour?
Ans: When an electron-hole pair recombines in a forward-biased LED, it emits a photon whose energy equals the semiconductor bandgap: $E_{photon} = hf = E_g$. A higher bandgap means higher-energy (shorter wavelength, higher frequency) photons — blue and green LEDs have larger bandgaps than red LEDs. Since the forward voltage $V_f \approx E_g/q$, a wider bandgap directly means a higher forward voltage. Red ($E_g \approx 1.8\text{ eV}$, $V_f \approx 1.8\text{ V}$) → green ($E_g \approx 2.2\text{ eV}$, $V_f \approx 2.2\text{ V}$) → blue ($E_g \approx 3.0\text{ eV}$, $V_f \approx 3.0\text{ V}$).
Q3. How is the current measured in this experiment without an ammeter?
Ans: The series resistor $R$ carries exactly the same current as the diode (they are in series). The voltage across $R$ is $V_R = V_{PV1} - V_D$, where $V_D$ is measured by A1. By Ohm's Law, $I = V_R/R = (V_{PV1} - V_D)/R$. Since $R$ is known and both voltages are measured, the current is determined purely from voltage readings — no separate current meter is needed. This indirect technique is standard in semiconductor characterisation.
Q5. What is the physical significance of the reverse saturation current $I_0$?
Ans: $I_0$ is the small current that flows through the diode under reverse bias, caused by thermally generated minority carriers (electrons in the p-region, holes in the n-region) that diffuse to the junction and are swept across by the built-in electric field. It is called the saturation current because increasing the reverse voltage beyond a few $kT/q$ does not increase it — the supply of thermally generated carriers is limited by temperature, not voltage. $I_0$ is extremely temperature-sensitive: it approximately doubles for every $10°C$ rise in temperature for silicon, which is why diode characteristics shift significantly with temperature.