Experiment: XY Plots and Lissajous Figures
1. Aim
To study the relationship between two independent electrical signals by plotting them against each other in XY mode and to observe Lissajous figures generated by different frequency ratios.
2. Apparatus / Components Required
- SEELab3 or ExpEYES-17 unit
- One LC Low Pass Filter (Inductor coil and 0.1uF Capacitor)
- Jumper wires
- PC or Smartphone with SEELab3 software
3. Theory & Principle
In standard oscilloscope mode, we plot Voltage (Y) vs. Time (X). In XY Mode, the software plots the instantaneous voltage of one channel (A1) on the X-axis and another channel (A2) on the Y-axis.
Lissajous Figures: When two sine waves are plotted against each other, the resulting pattern is called a Lissajous figure. These patterns are determined by:
- The ratio of their frequencies ($f_1 / f_2$).
- The phase difference between them ($\phi$).
If $f_x = f_y$ and they are in phase, the plot is a diagonal line. If they are $90^\circ$ out of phase, it is a circle. For more complex ratios like $1:2$, the figure resembles a figure-eight.
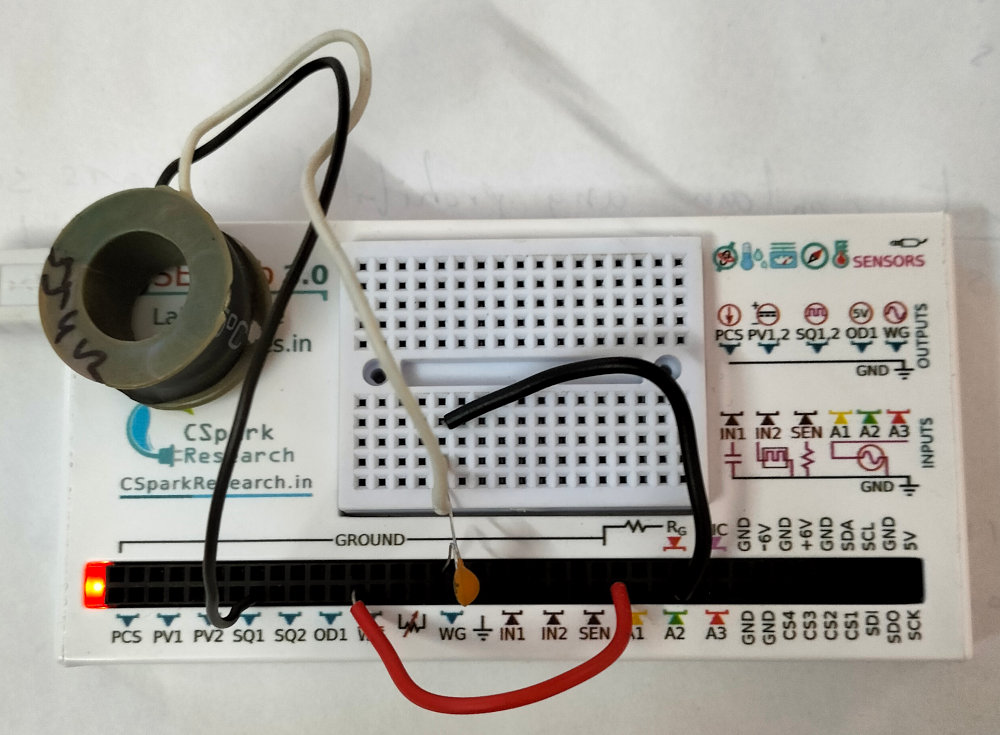
4. Circuit Diagram / Setup
- Direct XY: Connect WG to A1 and SQ1 to A2.
- Filter Setup (for complex curves): * Connect SQ1 ($1000\text{ Hz}$) to the input of an LC low-pass filter.
- Connect the output of the filter to A2. (This converts the square wave into a near-sine wave).
- Connect WG ($500\text{ Hz}$ sine wave) directly to A1.
5. Procedure
- Open the SEELab3 app and select the “XY Plot” experiment.
- Set WG to a $500\text{ Hz}$ Sine Wave.
- Set SQ1 to a $1000\text{ Hz}$ Square Wave.
- Observe the standard time-domain traces first to ensure both signals are stable.
- Switch the display mode to “XY Mode”.
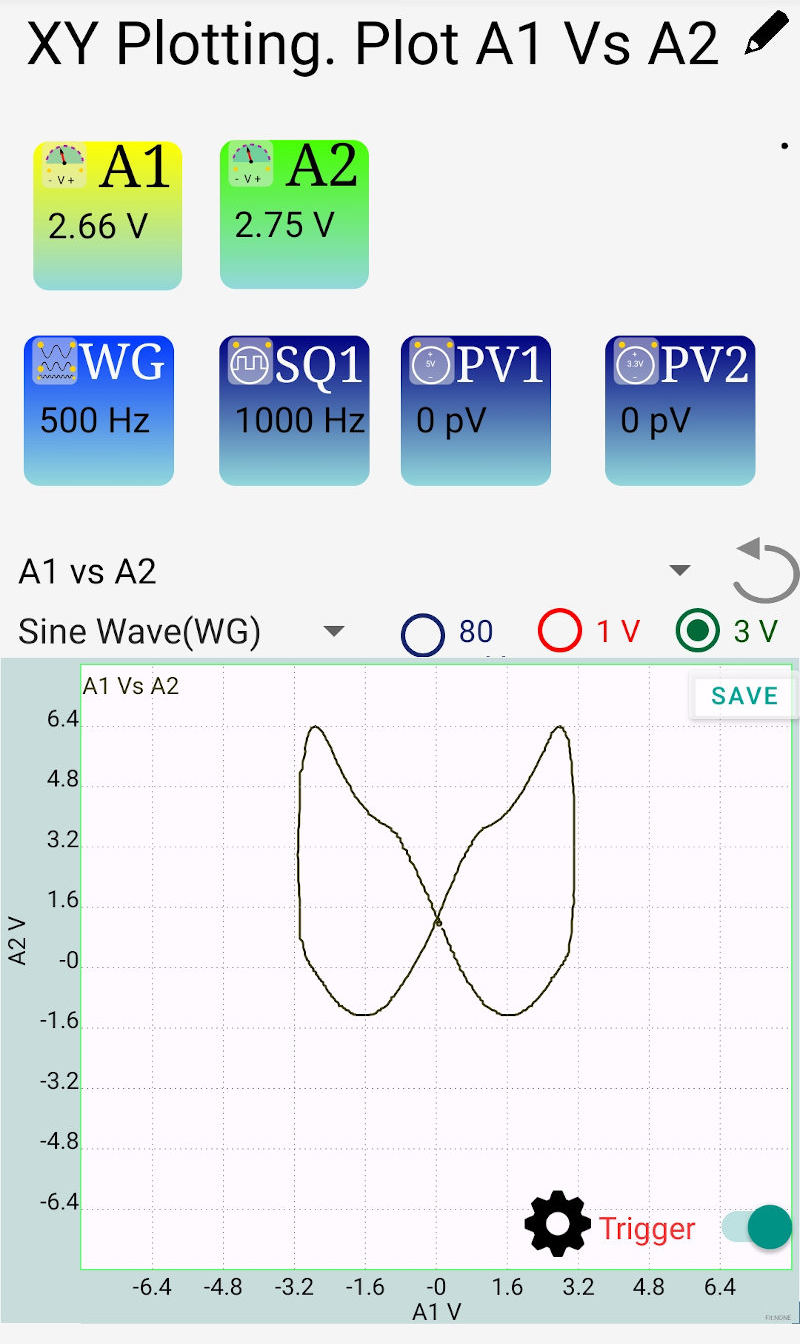
- Adjust the frequencies slightly to “freeze” the pattern. If the frequencies are exactly $1:2$, the figure-eight pattern will remain stationary. If they are slightly off, the pattern will appear to rotate as the phase drifts.
6. Observation Table
| Frequency A1 ($f_x$) | Frequency A2 ($f_y$) | Ratio ($X:Y$) | Pattern Description |
|---|---|---|---|
| 500 Hz | 500 Hz | 1:1 | Line / Ellipse / Circle |
| 500 Hz | 1000 Hz | 1:2 | Figure-eight (∞) |
| 1000 Hz | 500 Hz | 2:1 | Upright Figure-eight |
7. Results and Discussion
- The XY plot successfully visualized the phase and frequency relationship between two independent sources.
- Plotting a $500\text{ Hz}$ sine wave against a $1000\text{ Hz}$ filtered square wave produced a classic 1:2 Lissajous figure.
- It was observed that the stability of the figure depends on the precise synchronization of the two frequencies.
8. Precautions
- Filtering: Using a raw square wave on the Y-axis results in “jumping” dots rather than smooth curves. Passing the square wave through an LC filter smooths the transitions.
- Scaling: Ensure the Volt/Div settings for both A1 and A2 are similar so the figure is not squashed or stretched.
- Frequency Limits: Keep frequencies within the range where the software can maintain a high enough sampling rate for a smooth plot.
9. Troubleshooting
| Symptom | Possible Cause | Corrective Action |
|---|---|---|
| Pattern is a messy blur | Frequencies are not integer multiples. | Adjust one frequency until the ratio is exactly $1:1, 1:2,$ etc. |
| Pattern is rotating | Phase drift between sources. | This is normal for independent clocks; try to match the frequencies as closely as possible. |
| Only a dot is visible | One channel has 0V. | Check the connections for both A1 and A2. |
10. Viva-Voce Questions
Q1. What information can you get from a Lissajous figure?
Ans: Lissajous figures can be used to determine the unknown frequency of a signal (by comparing it to a known reference) and the phase difference between two signals of the same frequency.
Q2. What will the XY plot look like if two identical sine waves are $180^\circ$ out of phase?
Ans: It will be a straight line with a negative slope (leaning from top-left to bottom-right).
Q3. Why did we pass the square wave through an LC filter in this experiment?
Ans: A square wave contains many high-frequency harmonics. The LC low-pass filter removes these harmonics, leaving only the fundamental sine wave frequency. This results in a smooth, continuous Lissajous curve.
Q4. How do you calculate the frequency ratio from a stationary Lissajous figure?
Ans: By counting the number of horizontal and vertical lobes. The ratio of the number of tangencies to a vertical line vs. a horizontal line gives the frequency ratio $f_y / f_x$.
Q5. What is the XY plot of a sine wave vs. itself?
Ans: A straight line with a slope of 1 ($45^\circ$ angle), since the X and Y coordinates are always identical at every instant.