Experiment: Steady-State Response of a Series RL Circuit
1. Aim
To study the behavior of a series RL circuit under a sinusoidal (AC) voltage, and to measure the voltage amplitudes across each element and the phase difference between the applied voltage and the current.
2. Apparatus / Components Required
- SEELab3 or ExpEYES-17 unit
- One Inductor ($L = 10\text{ mH}$, with internal DC resistance $r \approx 20\text{ }\Omega$)
- One Resistor ($R = 1\text{ k}\Omega$)
- Connecting wires
- PC or Smartphone with SEELab3 / ExpEYES software
3. Theory & Principle
When a sinusoidal voltage $V(t) = V_0 \sin(\omega t)$ is applied to a series RL circuit, the inductor offers a frequency-dependent opposition called Inductive Reactance, given by:
\[Z_L = 2\pi f L\]Unlike a resistor, an ideal inductor does not dissipate energy — it stores energy in its magnetic field. However, a real inductor also has a small DC winding resistance $r$ that must be included. The effective series resistance is therefore $R_{eff} = R + r$.
The total impedance of the series RL circuit is:
\[Z = \sqrt{R_{eff}^2 + Z_L^2}\]The voltage across the inductor leads the current by $90°$ (i.e., $\frac{\pi}{2}$ radians). The phase angle between the applied voltage and the current (which is in phase with $V_R$) is:
\[\phi = \tan^{-1}\!\left(\frac{Z_L}{R_{eff}}\right)\]Since the voltages across $R$ and $L$ are $90°$ out of phase, the total applied voltage is obtained by phasor (vector) addition:
\[V_{applied} = \sqrt{V_R^2 + V_L^2}\]Note: For $R = 1\text{ k}\Omega$ (+ $20\text{ }\Omega$ winding resistance), $L = 10\text{ mH}$, and $f = 5000\text{ Hz}$, the inductive reactance $Z_L = 2\pi \times 5000 \times 0.01 \approx 314\text{ }\Omega$. The calculated phase angle is $\phi = 17.12°$ and the measured value is approximately $18°$. The small discrepancy is due to component tolerances and the winding resistance of the inductor.
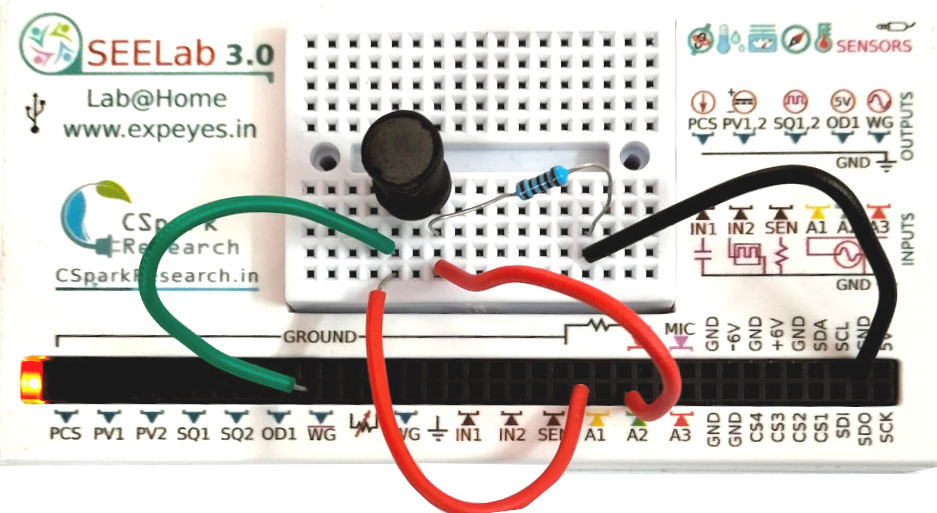
4. Circuit Diagram / Setup
- Series Connection: Connect the Resistor ($R$) and Inductor ($L$) in series.
- AC Source: Connect the free end of the inductor to WG (Wave Generator output of SEELab3/ExpEYES-17).
- Ground: Connect the free end of the resistor to GND.
- Measurement (Applied Voltage): Connect the WG end also to A1 to monitor the applied sinusoidal voltage.
- Measurement (Resistor Voltage): Connect the junction between $L$ and $R$ to A2 to monitor $V_R$ (which is in phase with the current).
5. Procedure
- Open the SEELab3 / ExpEYES app and select the “RL Steady State” experiment.
- Set the wave generator (WG) to output a sinusoidal signal at $f = 5000\text{ Hz}$.
- The oscilloscope screen will display three traces:
- The applied voltage (from WG / A1)
- The voltage across R ($V_R$, in phase with the current. A2.)
- The voltage across L ($V_L$, leading the current by $90°$ . calculated as A1-A2 )
- Note the peak amplitudes of each trace from the display.
- Observe the phase difference ($\phi$) between the applied voltage and $V_R$ as reported by the software.
- Vary the frequency (e.g., 1000 Hz, 2000 Hz, 5000 Hz, 10000 Hz) and repeat Steps 3–5 to study how $Z_L$ and $\phi$ change with frequency.
- Compare the measured phase angle and voltages with theoretically calculated values, remembering to include the winding resistance $r$ of the inductor.
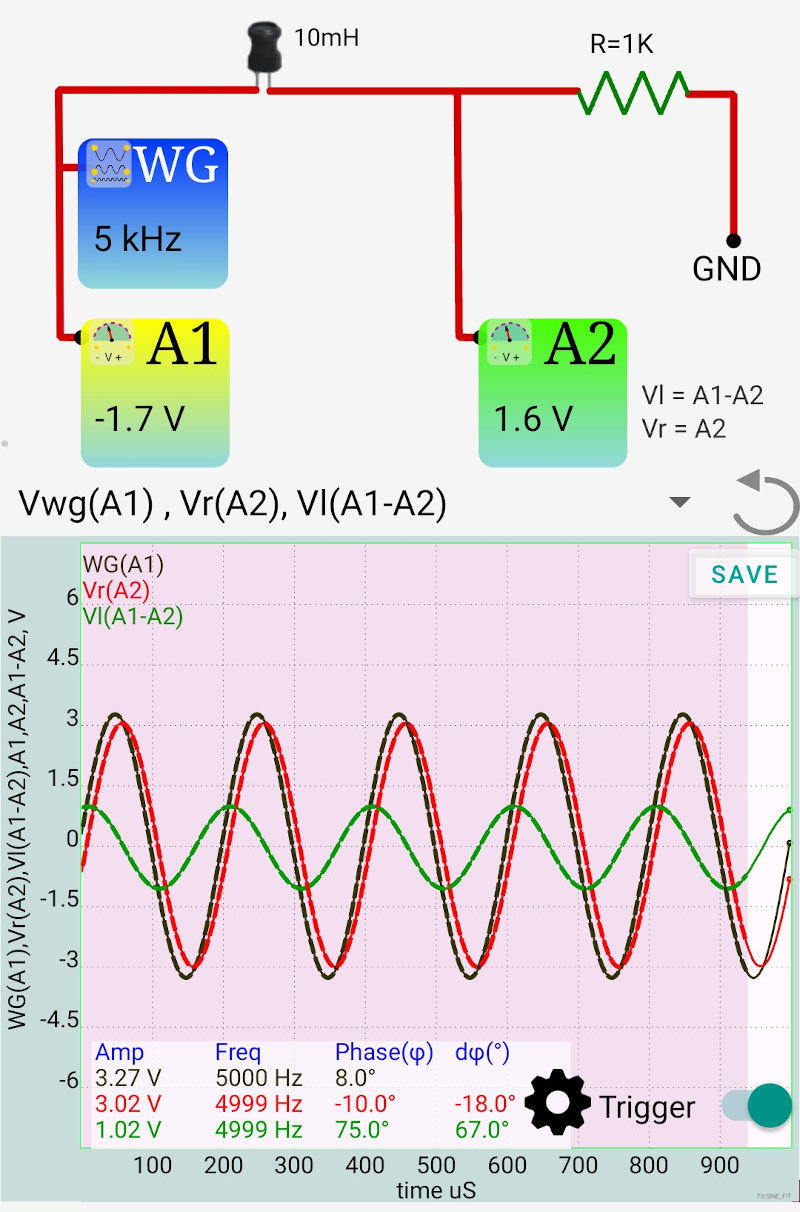
Steady State Response (Phone App)
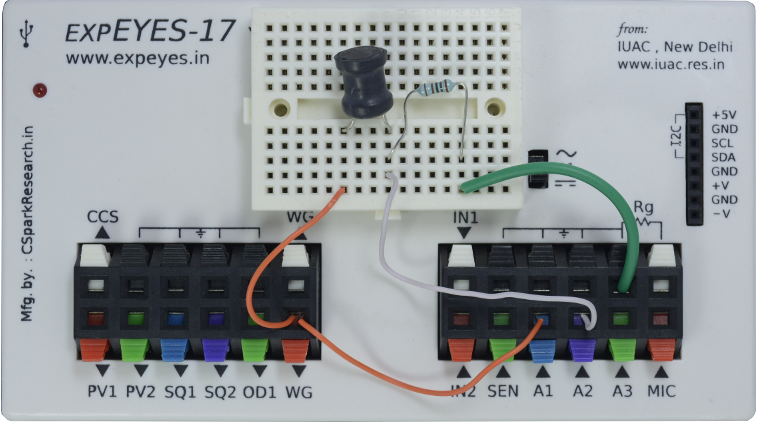
Steady State Setup For ExpEYES17
6. Observation Table
| Resistor ($R$): ____ $\Omega$ | Inductor ($L$): ____ mH | Winding Resistance ($r$): ____ $\Omega$ |
Effective Resistance $R_{eff} = R + r$: ____ $\Omega$
| Frequency $f$ (Hz) | $Z_L = 2\pi fL$ ($\Omega$) | Theoretical $\phi$ (°) | Measured $V_R$ (V) | Measured $V_L$ (V) | Measured $\phi$ (°) | $\sqrt{V_R^2 + V_L^2}$ (V) | Applied $V$ (V) |
|---|---|---|---|---|---|---|---|
| 1000 | |||||||
| 2000 | |||||||
| 5000 | |||||||
| 10000 | |||||||
| 20000 |
7. Results and Discussion
- The voltage across the inductor was observed to lead the current (and $V_R$) by approximately $90°$, which is opposite in sense to the RC circuit where $V_C$ lags.
- At $f = 5000\text{ Hz}$, the measured phase angle was found to be ____ °, against a theoretical value of $17.12°$.
- The vector sum $\sqrt{V_R^2 + V_L^2}$ was found to be ____ V, agreeing closely with the directly measured applied voltage of ____ V, verifying Kirchhoff’s Voltage Law in phasor form.
- As frequency increases, $Z_L$ increases, causing the phase angle $\phi$ to increase and $V_L$ to dominate over $V_R$. This is the dual behavior of an RC circuit, where $Z_C$ decreases with frequency.
8. Precautions
- Include Winding Resistance: A real inductor has a DC resistance $r$ in its winding. Always measure this with a multimeter and add it to $R$ when calculating the theoretical phase angle; ignoring it leads to a systematic error.
- Frequency Selection: Choose a frequency where $Z_L$ is comparable to $R_{eff}$ to get a clearly observable phase difference. For $L = 10\text{ mH}$ and $R = 1\text{ k}\Omega$, this is around $f \approx \frac{R}{2\pi L} \approx 15.9\text{ kHz}$. Lower frequencies like $5000\text{ Hz}$ give a small but measurable phase angle.
- Core Saturation: Do not use very large signal amplitudes with iron-core inductors, as the core may saturate, making the inductance non-linear and waveforms distorted.
- Stable Waveform: Allow the waveform display to stabilize for a few seconds before recording amplitudes and phase differences.
9. Troubleshooting
| Symptom | Possible Cause | Corrective Action |
|---|---|---|
| No phase shift visible; traces overlap | Frequency too low — $Z_L \ll R$, so inductor is nearly a short circuit at DC-like frequencies. | Increase frequency significantly (try 5000 Hz or higher). |
| Measured $\phi$ much larger than theoretical | Winding resistance $r$ not accounted for in calculation. | Measure $r$ with a multimeter and use $R_{eff} = R + r$ in the formula. |
| Waveforms are distorted / non-sinusoidal | Iron-core inductor saturating at high signal levels. | Reduce the WG output amplitude, or use an air-core inductor. |
| $V_L$ trace is flat or missing | Loose connection at the inductor or wrong channel assignment. | Check all connections; verify channel assignments in the software. |
10. Viva-Voce Questions
Q1. What is inductive reactance and how does it differ from resistance?
Ans: Inductive reactance ($Z_L = 2\pi fL$) is the opposition offered by an inductor to alternating current. Unlike resistance, it is directly proportional to frequency — it increases as frequency increases. A pure inductor stores energy in a magnetic field and releases it without dissipation, whereas a resistor permanently converts electrical energy into heat.
Q2. Why does the voltage across an inductor lead the current by 90°?
Ans: The voltage across an inductor is proportional to the rate of change of current: $V_L = L\frac{dI}{dt}$. A sinusoidal current $I = I_0 \sin(\omega t)$ gives $V_L = LI_0\omega\cos(\omega t) = LI_0\omega\sin(\omega t + 90°)$. Therefore the voltage always leads the current by exactly $90°$ in a pure inductor.
Q3. How does the behavior of an RL circuit differ from an RC circuit as frequency increases?
Ans: In an RL circuit, inductive reactance $Z_L = 2\pi fL$ increases with frequency, so $V_L$ grows and the phase angle $\phi$ increases toward $90°$ at very high frequencies (the circuit becomes predominantly inductive). In an RC circuit, capacitive reactance $Z_C = \frac{1}{2\pi fC}$ decreases with frequency, so $V_C$ shrinks and the phase angle decreases toward $0°$ — the two circuits are duals of each other.
Q4. Why must the winding resistance of the inductor be included in calculations?
Ans: A real inductor is wound from a long length of thin wire, which has a measurable DC resistance $r$. This resistance is always in series with the inductive reactance. Ignoring it means using an incorrect value of effective resistance $R_{eff}$, which causes the theoretical phase angle to differ from the measured value, even when the component values are otherwise accurate.
Q5. At what frequency will the voltages across R and L be equal in a series RL circuit?
Ans: The voltages are equal when $V_R = V_L$, which occurs when $R_{eff} = Z_L$, i.e., $R_{eff} = 2\pi fL$. Solving: $f = \frac{R_{eff}}{2\pi L}$. For $R_{eff} = 1020\text{ }\Omega$ and $L = 10\text{ mH}$, this gives $f \approx \frac{1020}{2\pi \times 0.01} \approx 16.2\text{ kHz}$. At this frequency, the phase angle $\phi = 45°$.