Experiment: Steady-State Response of a Series RC Circuit
1. Aim
To study the behavior of a series RC circuit under a sinusoidal (AC) voltage, and to measure the voltage amplitudes across each element and the phase difference between the applied voltage and the current.
2. Apparatus / Components Required
- SEELab3 or ExpEYES-17 unit
- One Resistor ($R = 1\text{ k}\Omega$)
- One Capacitor ($C = 1\text{ }\mu F$)
- Connecting wires
- PC or Smartphone with SEELab3 / ExpEYES software
3. Theory & Principle
When a sinusoidal voltage $V(t) = V_0 \sin(\omega t)$ is applied to a series RC circuit, the capacitor offers a frequency-dependent opposition called Capacitive Reactance, given by:
\[Z_C = \frac{1}{2\pi f C}\]The total impedance of the series RC circuit is:
\[Z = \sqrt{R^2 + Z_C^2}\]The current in the circuit leads the voltage across the capacitor by $90°$ (i.e., $\frac{\pi}{2}$ radians). The phase angle between the applied voltage and the current (which is in phase with $V_R$) is:
\[\phi = \tan^{-1}\!\left(\frac{Z_C}{R}\right)\]Since the voltages across $R$ and $C$ are $90°$ out of phase with each other, the total applied voltage is obtained by vector addition:
\[V_{applied} = \sqrt{V_R^2 + V_C^2}\]Note: For $R = 1\text{ k}\Omega$, $C = 1\text{ }\mu F$, and $f = 150\text{ Hz}$, the calculated phase angle is $\phi = 46.79°$, and the voltages across $R$ and $C$ are nearly equal, making this an ideal configuration to visualize the phase relationships.
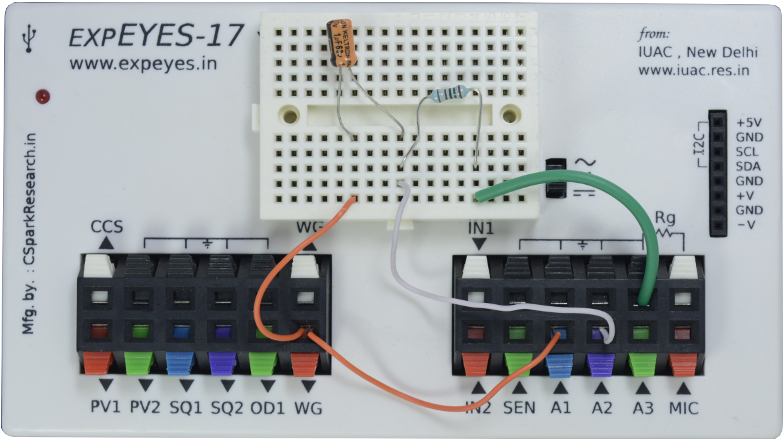
4. Circuit Diagram / Setup
- Series Connection: Connect the Capacitor ($C$) and Resistor ($R$) in series.
- AC Source: Connect the free end of the capacitor to WG (Wave Generator output of SEELab3/ExpEYES-17).
- Ground: Connect the free end of the resistor to GND.
- Measurement (Applied Voltage): Connect the WG end also to A1 to monitor the applied sinusoidal voltage.
- Measurement (Resistor Voltage): Connect the junction between $C$ and $R$ to A2 to monitor $V_R$ (which is in phase with the current).
- Measurement (Capacitor Voltage): $V_C$ can be derived as $V_{applied} - V_R$.
5. Procedure
- Open the SEELab3 / ExpEYES app and select the “RC Steady State” experiment.
- Set the wave generator (WG) to output a sinusoidal signal at $f = 150\text{ Hz}$.
- Click “Start” to begin data acquisition. The oscilloscope screen will display three traces:
- The applied voltage (from WG / A1)
- The voltage across R ($V_R$, in phase with the current)
- The voltage across C ($V_C$, lagging behind the current by $90°$)
- Note the peak amplitudes of each trace from the display.
- Observe the phase difference ($\phi$) between the applied voltage and $V_R$ as reported by the software.
- Vary the frequency (e.g., 50 Hz, 100 Hz, 200 Hz, 500 Hz) and repeat Steps 3–5 to study how $Z_C$ and $\phi$ change with frequency.
- Compare the measured phase angle and voltages with theoretically calculated values.
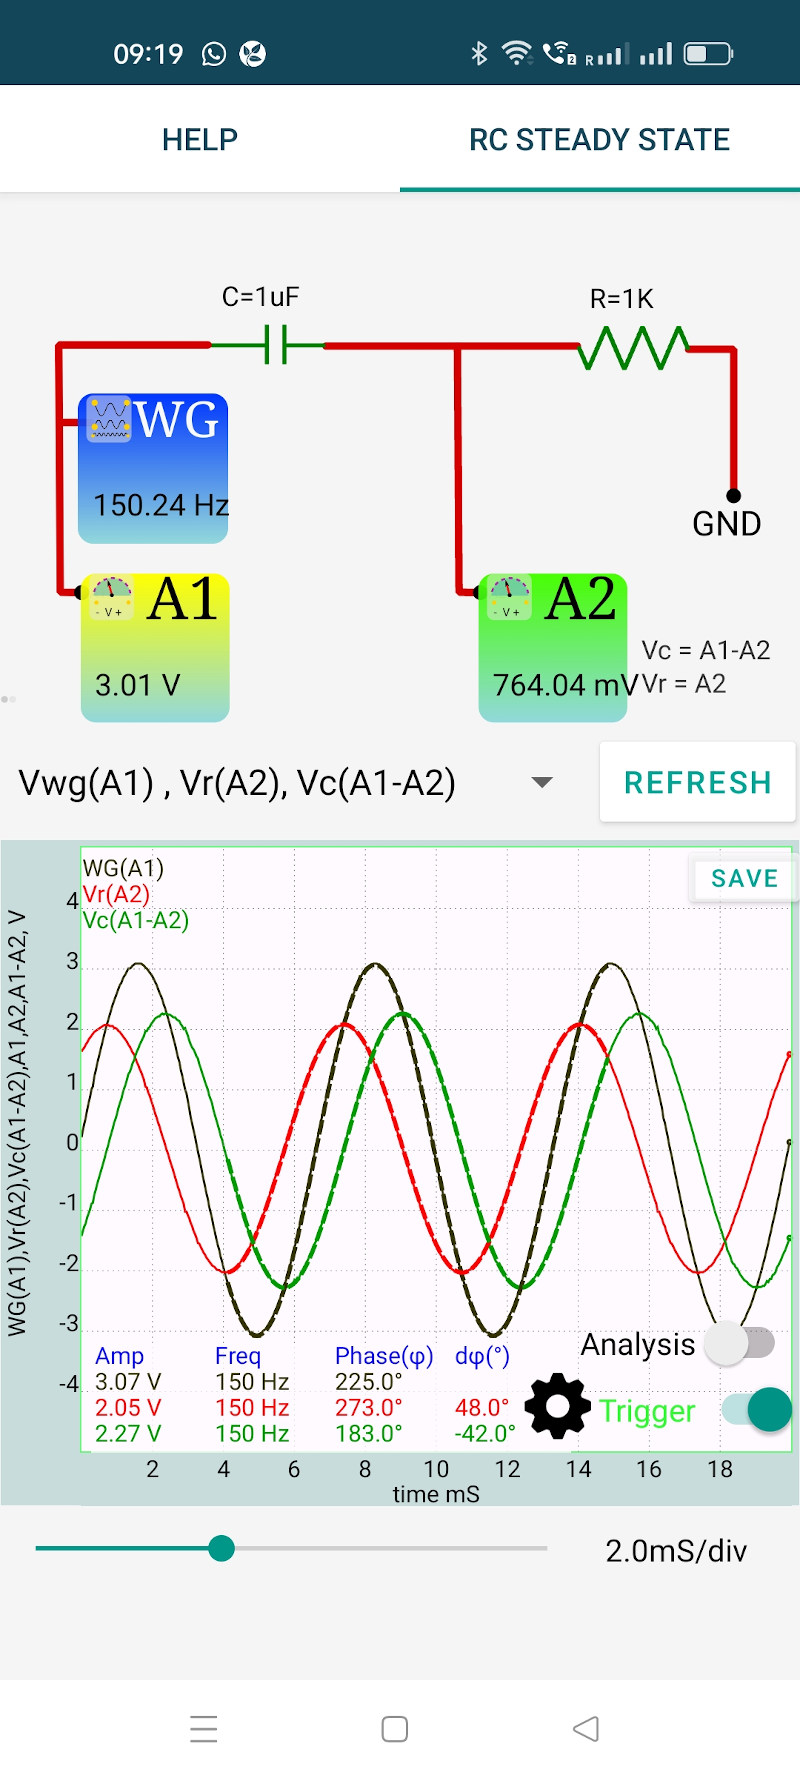
Steady State Response (Phone App)
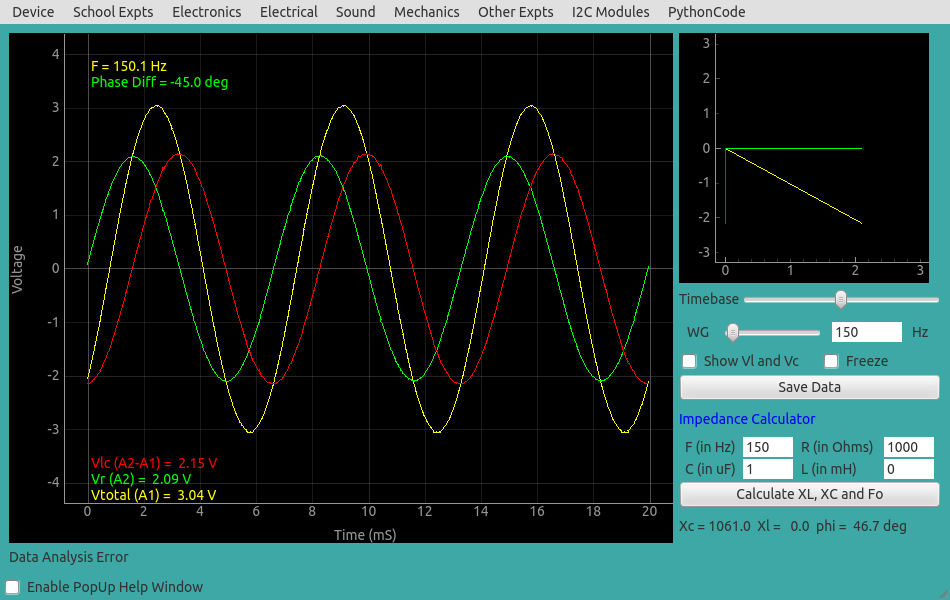
Steady State Response (Desktop)
6. Observation Table
| Resistor ($R$): ____ $\Omega$ | Capacitor ($C$): ____ $\mu F$ |
| Frequency $f$ (Hz) | $Z_C = \frac{1}{2\pi fC}$ ($\Omega$) | Theoretical $\phi$ (°) | Measured $V_R$ (V) | Measured $V_C$ (V) | Measured $\phi$ (°) | $\sqrt{V_R^2 + V_C^2}$ (V) | Applied $V$ (V) |
|---|---|---|---|---|---|---|---|
| 50 | |||||||
| 100 | |||||||
| 150 | |||||||
| 200 | |||||||
| 500 |
7. Results and Discussion
- The voltage across the capacitor was observed to lag behind the current (and $V_R$) by approximately $90°$.
- At $f = 150\text{ Hz}$, the measured phase angle was found to be ____ °, against a theoretical value of $46.79°$.
- The vector sum $\sqrt{V_R^2 + V_C^2}$ was found to be ____ V, which agrees closely with the directly measured applied voltage of ____ V, verifying Kirchhoff’s Voltage Law in phasor form.
- As frequency increases, $Z_C$ decreases, causing the phase angle $\phi$ to decrease and $V_R$ to dominate over $V_C$.
8. Precautions
- Frequency Selection: Choose a frequency where $Z_C \approx R$ (i.e., $f \approx \frac{1}{2\pi RC}$) to get a clear, observable phase difference and roughly equal voltage division. For $R = 1\text{ k}\Omega$, $C = 1\text{ }\mu F$, this is approximately $159\text{ Hz}$.
- Component Tolerance: Resistors and capacitors have manufacturing tolerances ($\pm 5\%$ to $\pm 20\%$). The measured phase angle may differ slightly from the theoretical value; this is expected.
- Input Impedance Loading: The $1\text{ M}\Omega$ input impedance of the measurement channels is much larger than the circuit impedances used here and can generally be ignored. However, for very high $R$ values, this loading effect must be considered.
- Stable Waveform: Allow the waveform display to stabilize for a few seconds before recording amplitudes and phase differences.
9. Troubleshooting
| Symptom | Possible Cause | Corrective Action |
|---|---|---|
| All three traces overlap / no phase shift visible | Frequency is too low or too high relative to RC values. | Set frequency closer to $\frac{1}{2\pi RC}$ for the chosen components. |
| $V_C$ trace is flat or missing | Loose connection at the capacitor or measurement channel. | Check and re-seat all connections; verify channel assignment in software. |
| Measured $\phi$ differs greatly from theoretical | Component tolerance or wrong component values used. | Measure $R$ and $C$ with a multimeter/LCR meter and recalculate. |
| Waveforms appear noisy or distorted | Poor ground connection or electrical interference. | Ensure a solid GND connection; keep leads short. |
10. Viva-Voce Questions
Q1. What is capacitive reactance and how does it differ from resistance?
Ans: Capacitive reactance ($Z_C = \frac{1}{2\pi fC}$) is the opposition offered by a capacitor to alternating current. Unlike resistance, it is frequency-dependent — it decreases as frequency increases. Additionally, resistance dissipates energy as heat, while a pure capacitor stores and releases energy without dissipation.
Q2. Why does the voltage across the capacitor lag behind the current by 90°?
Ans: The voltage across a capacitor is related to the charge stored: $V_C = Q/C$. Since current is the rate of change of charge ($I = dQ/dt$), the current must flow first to build up charge and hence voltage. This means the voltage always lags the current by exactly $90°$ (or $\frac{\pi}{2}$ radians) in a pure capacitor.
Q3. Why can't you simply add $V_R$ and $V_C$ algebraically to get the total applied voltage?
Ans: Because $V_R$ and $V_C$ are $90°$ out of phase with each other. Simple algebraic addition applies only to quantities that are in phase. For out-of-phase phasors, vector (phasor) addition must be used: $V_{applied} = \sqrt{V_R^2 + V_C^2}$.
Q4. What happens to the phase angle $\phi$ as the frequency of the applied voltage is increased?
Ans: As frequency increases, $Z_C = \frac{1}{2\pi fC}$ decreases. Since $\phi = \tan^{-1}(Z_C/R)$, a smaller $Z_C$ leads to a smaller phase angle. At very high frequencies, the capacitor behaves almost like a short circuit, $\phi \to 0°$, and the circuit becomes purely resistive.
Q5. At what frequency will the voltage across the resistor and capacitor be equal in magnitude?
Ans: The voltages are equal when $V_R = V_C$, which occurs when $R = Z_C$, i.e., $R = \frac{1}{2\pi fC}$. Solving for frequency: $f = \frac{1}{2\pi RC}$. For $R = 1\text{ k}\Omega$ and $C = 1\text{ }\mu F$, this gives $f \approx 159\text{ Hz}$. At this frequency, the phase angle $\phi = 45°$.