Diode I–V via Python (eyes17)
This unit shows how to drive PV1, read A1, and plot a junction diode’s forward characteristic using the eyes17 Python API (ExpEYES-17 / SEELab3). For theory, precautions, and the full written lab, see V-I Characteristics of a PN Junction.
1. Aim
To acquire a diode current–voltage curve from a Python script: sweep PV1, measure diode voltage on A1, infer current from the drop across a known series resistor, and plot the result — optionally with a live Matplotlib sweep and UI buttons.
2. Requirements
- SEELab3 / ExpEYES-17 connected over USB
- Python 3 with
eyes17,matplotlib - Diode (e.g. 1N4148), series resistor $R = 1\,\text{k}\Omega$, wires (same topology as the main diode manual)
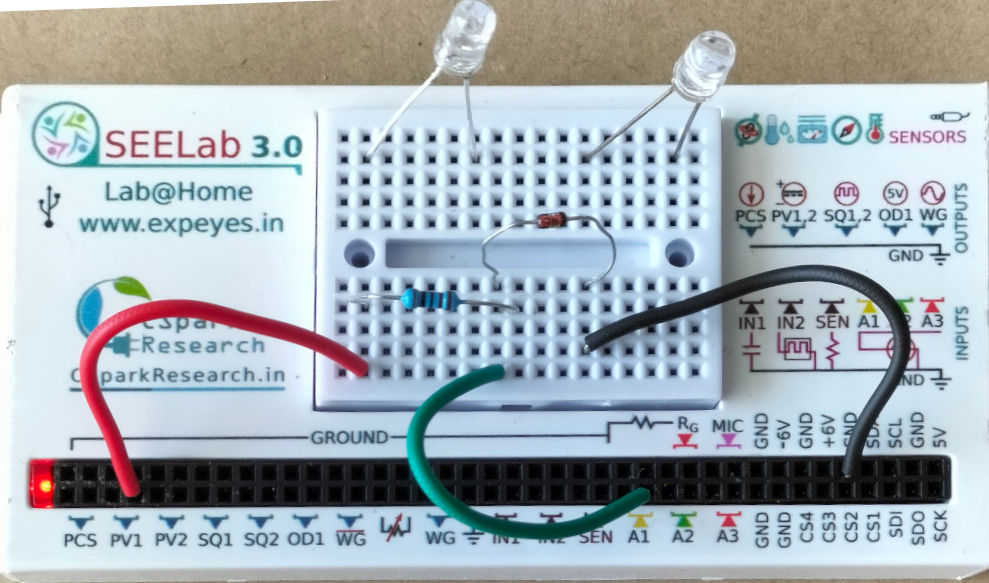
Wiring: PV1 → $R$ → diode anode; diode cathode → GND; A1 across the diode (anode to A1, cathode to GND).
Current in mA (with $R$ in $\Omega$):
\[I_{\text{mA}} = \frac{V_{\text{PV1}} - V_{\text{A1}}}{R} \times 1000\]For $R = 1\,\text{k}\Omega$, $I_{\text{mA}} \approx (V_{\text{PV1}} - V_{\text{A1}})$ when both voltages are in volts.
3. Simple example — single sweep and static plot
1
2
3
4
5
6
7
8
9
10
11
12
13
14
15
16
17
18
19
20
21
22
23
import eyes17.eyes
import matplotlib.pyplot as plt

p = eyes17.eyes.open()

R_OHM = 1000.0
voltage = []
current = []

v = 0.0
while v <= 5.0:
    v_pv1 = p.set_pv1(v)
    v_diode = p.get_voltage("A1")
    i_ma = (v_pv1 - v_diode) / R_OHM * 1000.0
    voltage.append(v_diode)
    current.append(i_ma)
    v += 0.050  # 50 mV steps

plt.xlabel("Diode voltage (V)")
plt.ylabel("Current (mA)")
plt.plot(voltage, current, linewidth=2)
plt.grid(True)
plt.show()
4. A more thorough example — live tracing, auto-scaling, Matplotlib widgets etc.
1
2
3
4
5
6
7
8
9
10
11
12
13
14
15
16
17
18
19
20
21
22
23
24
25
26
27
28
29
30
31
32
33
34
35
36
37
38
39
40
41
42
43
44
45
46
47
48
49
50
51
52
53
54
55
56
57
58
59
60
61
62
63
64
65
66
67
68
69
70
71
72
73
74
75
76
77
import time

import eyes17.eyes
import matplotlib.pyplot as plt
from matplotlib.widgets import Button

p = eyes17.eyes.open()

fig, ax = plt.subplots(figsize=(10, 7))
plt.subplots_adjust(bottom=0.2)

ax.set_xlim(0, 3.0)
ax.set_ylim(0, 5.0)
ax.set_xlabel("Voltage across diode (V)")
ax.set_ylabel("Current (mA)")
ax.set_title("Live diode I–V (matplotlib)")
ax.grid(True)

R_OHM = 1000.0
traces = []


def run_sweep(event):
    voltages = []
    currents = []

    new_trace, = ax.plot([], [], "-o", markersize=3, label=f"Trace {len(traces) + 1}")
    traces.append(new_trace)
    ax.legend()

    for v_out in [x * 0.05 for x in range(0, 101)]:
        p.set_pv1(v_out)
        time.sleep(0.01)

        v_diode = p.get_voltage("A1")
        i_ma = (v_out - v_diode) / R_OHM * 1000.0

        voltages.append(v_diode)
        currents.append(i_ma)
        new_trace.set_data(voltages, currents)

        cur_xmin, cur_xmax = ax.get_xlim()
        cur_ymin, cur_ymax = ax.get_ylim()

        if v_diode > cur_xmax:
            ax.set_xlim(0, v_diode * 1.1)
        if i_ma > cur_ymax:
            ax.set_ylim(0, i_ma * 1.1)

        fig.canvas.draw()
        fig.canvas.flush_events()

    p.set_pv1(0)


def clear_plots(event):
    for line in traces:
        line.remove()
    traces.clear()
    ax.set_xlim(0, 3.0)
    ax.set_ylim(0, 5.0)
    leg = ax.get_legend()
    if leg is not None:
        leg.remove()
    fig.canvas.draw()


ax_new = plt.axes([0.15, 0.05, 0.2, 0.075])
ax_clear = plt.axes([0.65, 0.05, 0.2, 0.075])

btn_new = Button(ax_new, "New trace", color="lightgreen", hovercolor="green")
btn_clear = Button(ax_clear, "Clear all", color="tomato", hovercolor="red")

btn_new.on_clicked(run_sweep)
btn_clear.on_clicked(clear_plots)

plt.show()
5. Notes
- Series resistor: Do not connect PV1 directly to the diode; limit current with $R$ (see the main diode manual).
set_pv1return value: The simple loop uses the value returned byset_pv1as $V_{\text{PV1}}$; the button example uses the commandedv_outfor consistency with your original script — both are fine if PV1 tracks well.- Sweep limit: For a small signal diode, keep PV1 and current within the device ratings; reduce the upper limit in the
rangeloop if needed.