Experiment: Phase Relationship in AC Inductive Circuits
1. Aim
To study the phase relationship between voltage and current in an AC circuit containing an inductor and a resistor, and to verify that voltage leads current in an inductive circuit.
2. Apparatus / Components Required
- SEELab3 or ExpEYES-17 unit
- One Resistor ($R = 100\text{ }\Omega$ or $1000\text{ }\Omega$)
- One Inductor (e.g., 10mH provided in the kit)
- Connecting wires
- PC or Smartphone with SEELab3 software
3. Theory & Principle
An inductor opposes changes in current by storing energy in a magnetic field. This property, known as self-inductance ($L$), causes the current to “lag” behind the applied voltage.
In a purely inductive circuit, the voltage leads the current by exactly $90^\circ$ ($\pi/2$ radians). In a series RL circuit, the phase angle $\phi$ is between $0^\circ$ and $90^\circ$, determined by the resistance ($R$) and the inductive reactance ($X_L$): \(X_L = 2\pi f L\) \(\phi = \tan^{-1}\left(\frac{X_L}{R}\right)\)
Current Measurement:
We measure the voltage across a series resistor ($R$) to represent the current waveform ($I = V_R / R$). Since $V_{total}$ is measured at A1 and $V_R$ is measured at A2, the voltage across the inductor is calculated mathematically as $V_L = A1 - A2$.
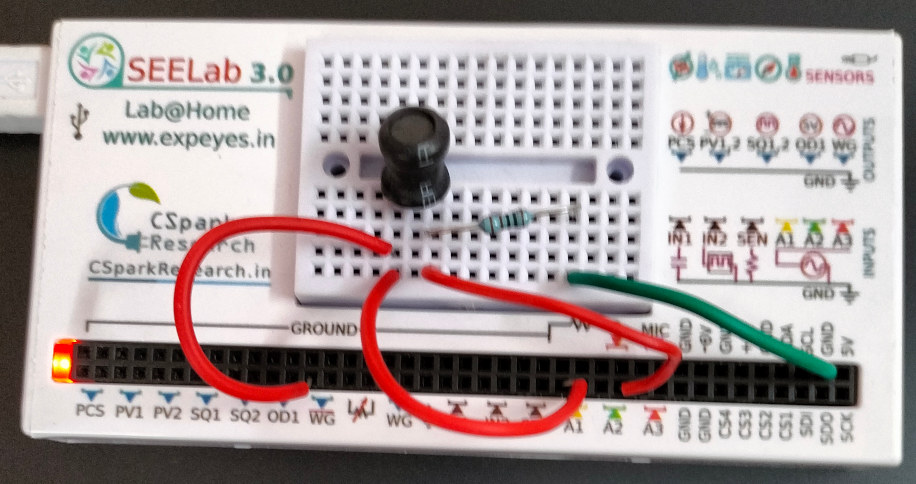
4. Circuit Diagram / Setup
- Connect the Inductor ($L$) and Resistor ($R$) in series between WG and GND.
- Connect A1 to WG (measures total voltage $V_{total}$).
- Connect A2 to the junction between the Inductor and the Resistor.
- In this configuration, A2 measures the voltage across the Resistor ($V_R$), which is in phase with the current ($I$).
- The voltage across the Inductor ($V_L$) is obtained as A1 - A2.
5. Procedure
- Launch the SEELab3 software and select the “AC through Inductor” experiment.
- Set WG to a sine wave (e.g., $4000\text{ Hz}$ or $5000\text{ Hz}$ to get significant reactance).
- Enable traces for A1 and A2.
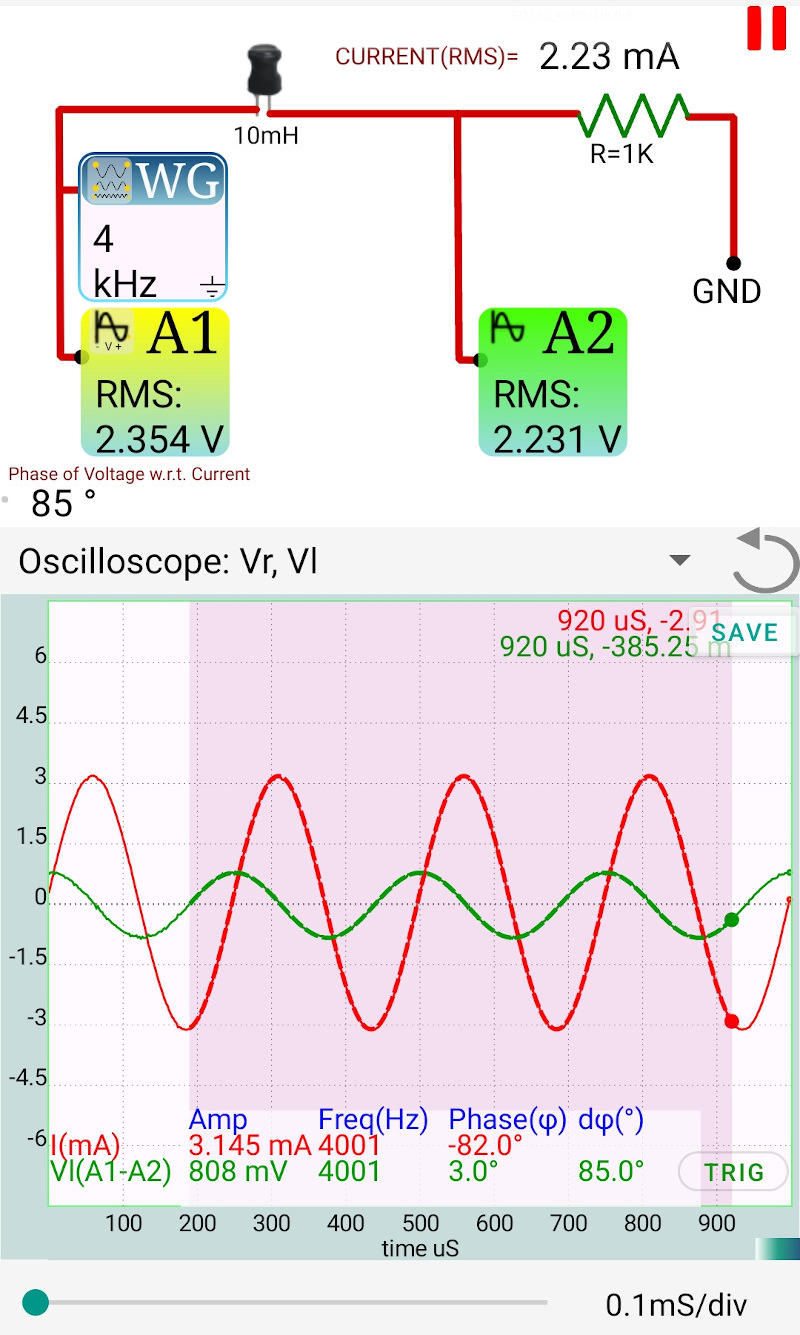
- Select a region of the graph. The software will extract the amplitudes and phases using mathematical curve fitting.
- Observe that the peak of the voltage across the inductor ($A1-A2$) occurs before the peak of the current (A2). This confirms that voltage leads the current.
- Note the phase difference $\phi$ and calculate the inductance $L$ using the formula $L = X_L / (2\pi f)$.
6. Observation Table
| Resistance ($R$): ____ $\Omega$ | Rated Inductance ($L$): ____ mH |
| Parameter | Measured Value |
|---|---|
| Applied Frequency ($f$) | |
| Peak Voltage $V_L$ ($A1 - A2$) | |
| Peak Current $I_p$ ($V_{A2}/R$) | |
| Phase Difference ($\phi$) | |
| Calculated Inductance ($L$) |
7. Error Analysis
The measurement of inductance $L$ is subject to errors from the reference resistor $R$ and the inductor’s own internal DC resistance ($R_L$).
The percentage error in $L$ can be estimated as: \(\frac{\Delta L}{L} \approx \frac{\Delta R}{R} + \frac{\Delta f}{f} + \frac{\Delta \phi}{\sin \phi \cos \phi}\)
Key Factors Affecting Accuracy:
- Inductor Resistance: Real inductors have a finite resistance $R_L$. If $R_L$ is not accounted for, the phase shift will be less than the theoretical $90^\circ$ even if the series resistor $R$ is small.
- Frequency Selection: At low frequencies, $X_L$ is small compared to $R_L + R$, making the phase shift difficult to measure accurately. Always use higher frequencies ($>2\text{ kHz}$) for small inductors.
8. Results and Discussion
- The voltage waveform across the inductor reaches its maximum value before the current waveform.
- The measured phase shift $\phi$ was approximately ____ degrees.
- As the frequency increases, the inductive reactance $X_L$ increases, which ____ (increases/decreases) the phase shift towards $90^\circ$.
9. Python Programming & Data
The SEELab3 software uses the capture2 function to retrieve the waveforms. The phase difference between the fitted sine waves $(\theta_1 - \theta_2)$ and the ratio of amplitudes allow for the calculation of Inductive Reactance ($X_L$) and Inductance ($L$).
10. Troubleshooting
| Symptom | Possible Cause | Corrective Action |
|---|---|---|
| Phase shift is ~0° | Frequency is too low. | Increase the WG frequency; $X_L$ is proportional to frequency. |
| Noisy Waveform | High resistance of coil. | Ensure you are using the correct coil and connections are tight. |
| A1-A2 looks distorted | Input range exceeded. | Ensure the peak voltage at WG is within the $\pm 5V$ limit. |
11. Viva-Voce Questions
Q1. Why does the voltage lead the current in an inductor?
Ans: According to Lenz's Law, an inductor creates a back-EMF to oppose the change in current. This opposition is strongest when the current is changing most rapidly (at the zero-crossing), causing the voltage to reach its peak before the current does.
Q2. What happens to the inductive reactance if the frequency of the AC signal is doubled?
Ans: Since $X_L = 2\pi f L$, the inductive reactance is directly proportional to frequency. Doubling the frequency will double the inductive reactance.
Q3. How does the presence of an iron core inside the inductor affect the results?
Ans: An iron core increases the permeability ($\mu$), which significantly increases the inductance $L$. This will result in a larger inductive reactance and a larger phase shift at the same frequency.