Python code to get osciloscope data
| Links:
Nothing to see here.
useful to directly pull data onto a PC.
Rules for ubuntu. on windows feel free to struggle with drivers or Zadig
#/etc/rules.d/99-keysight.rules
#sudo service udev restart
SUBSYSTEM=="usb", ATTRS{idVendor}=="2a8d", ATTRS{idProduct}=="179b", MODE="0666", GROUP="plugdev"
import usbtmc
import matplotlib.pyplot as plt
import numpy as np
import time
# 1. Connect to the oscilloscope
# Use the Vendor ID (VID) and Product ID (PID) for the Keysight EDUX1002A
# The values are 0x0957 (Keysight) and 0x5731 (EDUX1002A)
# These may vary, so check your device manager if it fails.
try:
dev = usbtmc.Instrument(0x02a8d, 0x179b)
# dev.timeout = 20 # Set timeout if needed, in seconds
print(f"Connected to: {dev.ask('*IDN?')}")
time.sleep(1) # Wait for device to be ready
except usbtmc.usbtmc.UsbtmcException as e:
print(f"Error connecting to the oscilloscope: {e}")
print("Make sure the correct drivers are installed and the oscilloscope is connected.")
exit()
# 2. Configure the oscilloscope for data transfer
# Set the timebase to 500 uS/div
dev.write(":TIMebase:SCALe 500e-6")
# Set the voltage scale for Channel 1 to 10 V/div
dev.write(":CHANnel1:SCALe 10")
# Set waveform acquisition parameters
dev.write(":WAVeform:SOURce CHANnel1")
dev.write(":WAVeform:FORMat ASCii")
#dev.write(":WAVeform:POINts 10000") # Set the number of points as requested
dev.write(":WAVeform:POINts MAX") # Use the maximum available points (1Mpts)
# Read the preamble
preamble_str = dev.ask(":WAVeform:PREamble?")
print(preamble_str)
# The original list has only 10 elements (index 0 to 9)
preamble_list = preamble_str.strip().split(',')
# Assign values based on the correct indices
# e.g., format, type, points, count, xincrement, xorigin, xreference, yincrement, yorigin, yreference
xincrement = float(preamble_list[4])
xorigin = float(preamble_list[5])
# Correct the indices for yincrement, yorigin, and yreference
yincrement = float(preamble_list[7]) # Correct index
yorigin = float(preamble_list[8]) # Correct index
yreference = float(preamble_list[9]) # Correct index
# Query and read the waveform data
data_str = dev.ask(":WAVeform:DATA?")
# Find the end of the header and slice the string
header_end = data_str.find(' ') + 1
data_str_clean = data_str[header_end:].strip()
# Convert to a NumPy array
data_list = data_str_clean.split(',')
waveform_data = np.array([float(val) for val in data_list if val])
# Process and plot the data
y_values = (waveform_data - yreference) * yincrement + yorigin
x_values = np.arange(len(y_values)) * xincrement + xorigin
print('points:',len(y_values))
plt.figure(figsize=(10, 6))
plt.plot(x_values, y_values)
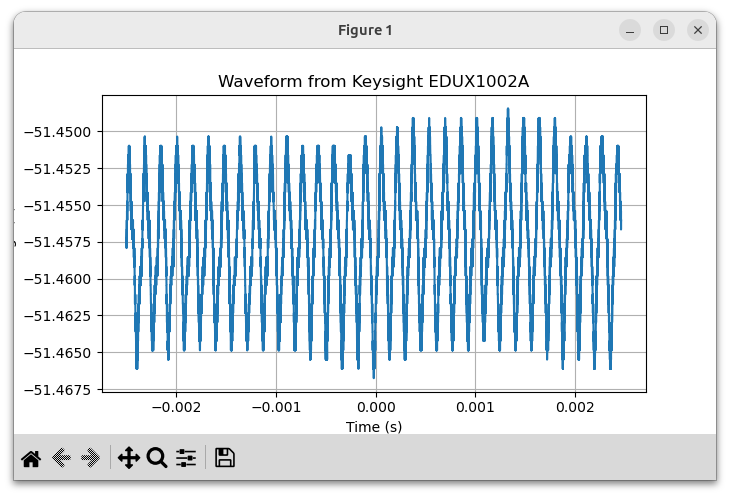
plt.title("Waveform from Keysight EDUX1002A")
plt.xlabel("Time (s)")
plt.ylabel("Voltage (V)")
plt.grid(True)
plt.show()
# Close the connection
dev.close()
print("Connection to the oscilloscope closed.")