Web Based Graphical coding
Hobby Projects | Links: Youtube
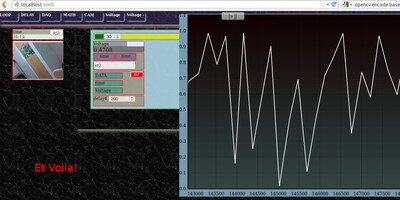
Readings acquired from an instrument are being plotted in real time
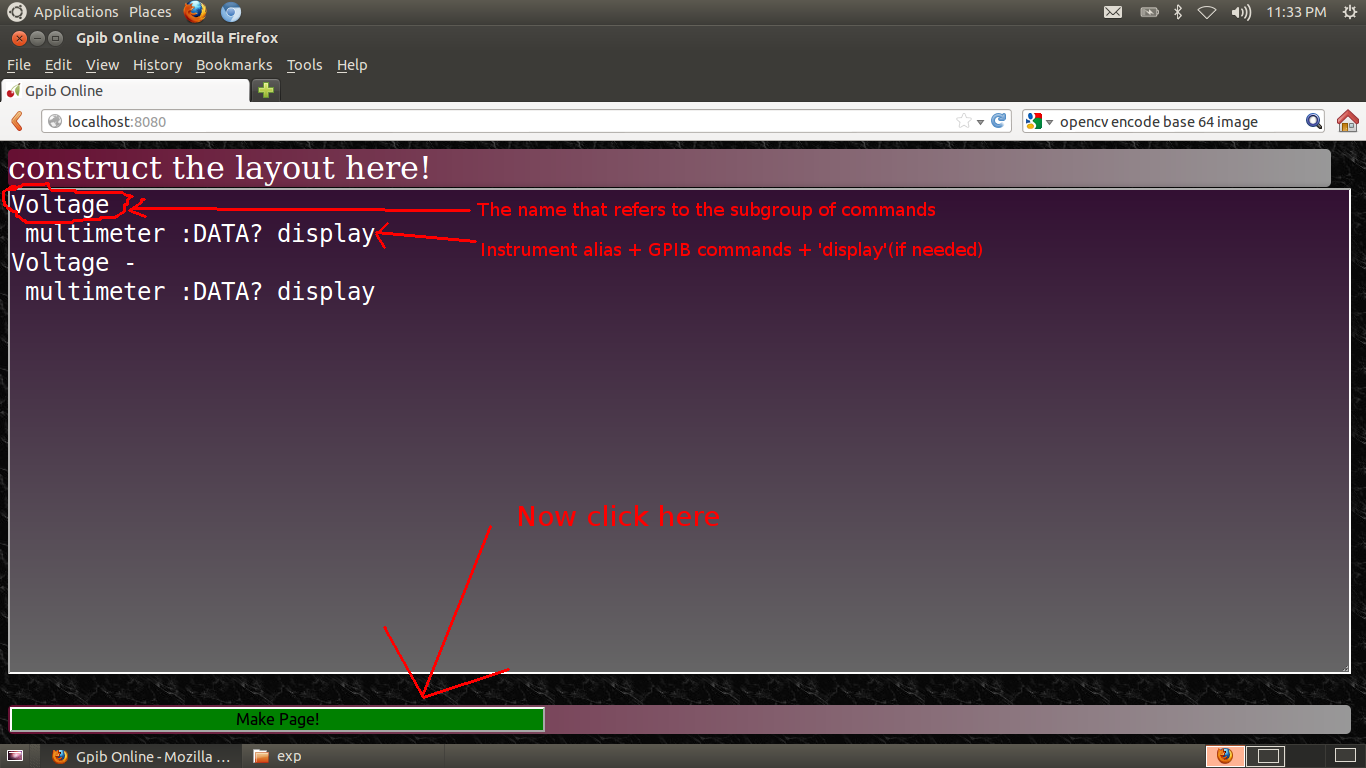 Simple text based configuration file can be used to generate a graphical control screen. The mnemonics need to be mapped to the corresponding GPIB addresses on linux-gpib running on the server. Adding an optional ‘display’ argument activates a display field in the GUI
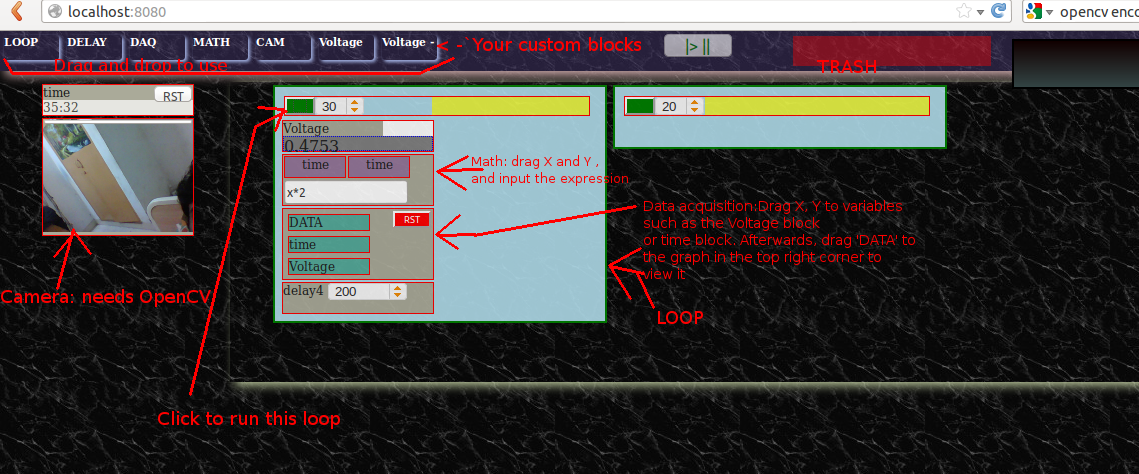 JQuery-UI based widgets can be dragged around and repositioned. Interconnects can be made by dragging labels and dropping them on targets. The GUI also enables a real-time camera feed.
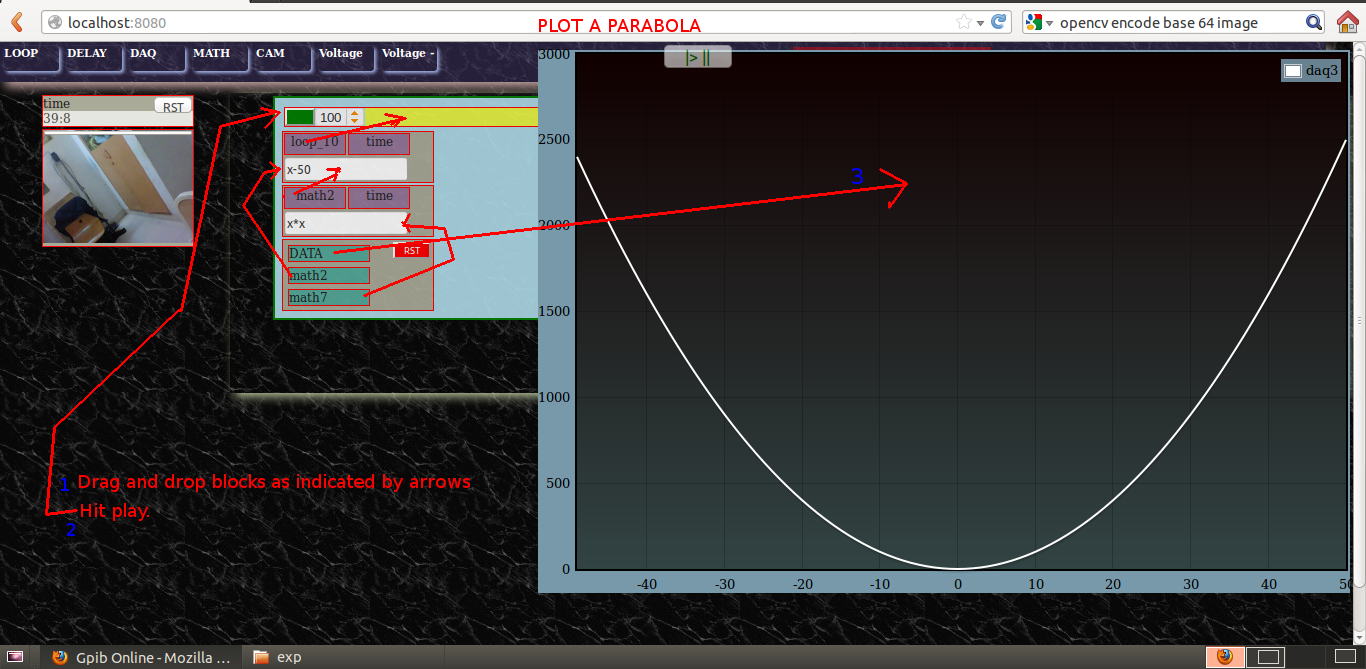 Plotting a Parabola. A simple demonstration on how to use the loops and variables to plot a parabola
This web based application allows users to quickly set up data acquisition rigs on a web-browser that remotely interfaces with scientific instruments connected to the web server.
I wrote the backend on Python which uses CherryPy to host webpages as well as real-time data from instruments. OpenCV is used to read the data stream from a webcam, and Python-gpib (a wrapper for linux-gpib) interfaces with GPIB dongles.
The Jquery-AJAX based frontend serves as a primitive programming interface. I’ve included support for variables as well as a few loops. Plotting is carried out using flot.jquery. This was how I started out with JQuery, and JS in general, and a lot of good open-source platforms for webapps have emerged since. therefore, this project stands abandoned.